Summary: Reviewed several patterns for integrated monitoring with Nagios and Nagira . Nagira — RESTful API for Nagios simplifies integration of distributed Nagios systems . This is first installation of the series.
Nagios is great system. Many features in Nagios are superior to many open source and commercial monitoring system. Adding HTTP based API for Nagios opens new possibilities for simpler architectures of distributed monitoring with Nagios.
Nagira API provides access to system status, objects configuration in Nagios as well as provides an interface for submitting passive check results using the same HTTP protocol. This opens wider capabilities for monitoring system architecture modularity and integration.
Applications with HTTP RESTful API
Here I want to review one of the simplest patterns with Nagira - monitoring applications that have built-in HTTP API (RESTful API in our case). This pattern was implemented recently in new project Nagios For Couchbase. Similar approach can be adopted for any kind of application, that provides access to application metrics via HTTP API.
Nagios For Couchbase
Couchbase is advanced memory based NoSQL key-value database. It has its own management RESTful API and API for data access. The API provides access to most if not all of the Couchbase operational metrics. Couchbase also has nice web console with multiple graphs displaying server metrics in real time. Actually web user interface in Couchbase is implemented as jQuery interface built directly on top of JSON RESTful API.
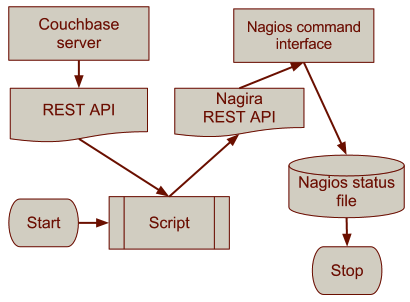
Given Couchbase API combined with Nagira API, setting a monitoring system becomes a simple task. Architecture of such setup is presented on the diagram below.
System Architecture
- Script connects to Couchbase API and retrieves server metrics as JSON data object (via HTTP GET request)
- Script process data and
- Sends data to Nagira API (HTTP PUT)
- Nagira writes to Nagios external command interface
- Results are then processed internally by Nagios

Advantages of this architecture as far as one can see are:
- Since only HTTP protocol involved for both retrieving data and registering results, script that runs the checks, can be in any location — on Couchbase server, or on Nagios server or any other host on the network.
- List of couchbase servers can be retrieved from Nagios configuration itself, if corresponding host-group is configured (for example
'hostgroup couchbase'). Configuration becomes completely data driven and requires no additional changes when adding/removing Couchbase servers to the pool. - JSON object containing multiple metrics can be read as with single HTTP GET request to Couchbase server, status for multiple checks can be updated similarly with single HTTP PUT to Nagira API, which produces multiple writes to Nagios command file. This reduces load on Nagios server, which is not dealing with scheduling and executing checks.
Executing Checks
How actually checks are performed will be reviewed in some of the following posts. Please come again!
Author
Dmytro Kovalov (dmytro.kovalov@gmail.com)
Source code
- Download nagira in either zip or tar formats ⇒
- Clone nagira with git
$ git clone git://github.com/dmytro/nagira
- or go to nagira's Github repository »


