

Summary: Reviewed several patterns for integrated monitoring with Nagios and Nagira . Nagira — RESTful API for Nagios — simplifies Nagios checks aggregation . For second part of the series an easy way of combining several Nagios results into aggregated check is presented.
Nagios Checks Aggregation
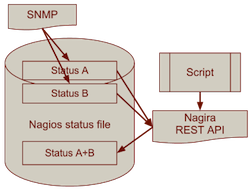
This kind of setup is applicable in situations where there is a need to integrate several already existing Nagios checks, but you need to aggregate information from checks into combined metric. In this case all necessary information already exists in Nagios, there is no need to read it from monitored devices, API can fetch source information from Nagios status store and write back calculated output. See diagram below.
Computer Rack Prower Monitoring
An example of such setup is an electric current monitoring system.
Electric current of the power lines in a computer rack are monitored by Nagios. Information from power lines is collected by SNMP. Computer racks have two power inputs for redundancy; servers, having similarly two redundant power supplies each, are connected to both power inputs.
However, additional requirement exist for monitoring gross current consumed by each rack. For example, in the case of one side power source failure, the whole rack power can fail if sum total of currents is higher than power limit for the remaining source — even if each of the power lines before the failure is in a green zone.
In this case, to obtain data for the pair of power sources, data of each individual line is read from Nagios status database, instead of using SNMP. Data processed by script, and if total gross current of two power lines is greater than current limit for single line, status is marked as WARNING or CRITICAL. Resulting combined metric (sum of two currents) is written back to Nagios together with RAG status. All communication — reads and writes — are done only using web-services Nagira API.
Possible uses
Other examples where such kind of setup can be applied are:
- load balanced or DNS round-robin farm of web servers, to monitor total network traffic, not only traffic on individual servers;
- status of clustered application — if it is known, for example, that application execution requires
Xnumber of servers withYCPU cores, each occupied byZ%.
See more
- Nagios External Commands interface
- Monitoring patterns for Nagios with Nagira API - Part I
- Nagira Documentation
Author
Dmytro Kovalov (dmytro.kovalov@gmail.com)
Source code


- Download nagira in either zip or tar formats ⇒
- Clone nagira with git
$ git clone git://github.com/dmytro/nagira
- or go to nagira's Github repository »